Statistics by conversions (new) - can be opened in your account in the project list by clicking on the “Statistics” tab. Or in the same way, but not in the project list, but inside the specific project. Look for the tab on the control panel above.
There are 3 types of tables with statistics by conversions available in your account:
• by projects - a separate table for each project in a section by days (each column in the table is one day for the selected period);
• by account - a common table in the section for each project (one column in the table - certain project with its own data);
• Common - a common table in a section by days (one column in the table - one day for the selected period and data for this day in total for all projects).
Conversion is the ratio of the number of conversion actions to the total number of actions. This is a vague wording that describes the essence of the task - to find out the percentage of (useful) orders that interest us from the total amount of all orders.
Can be represented as a formula:
conversion action / all actions * 100%
In our case, all orders that were created during the period of interest are selected as “all actions” or “the total amount of all orders”.
Let's figure out a specific example. This is how conversion statistics look like
If you look at the statistics for a specific period, the value we need will be the number of all orders for which the order creation date corresponds to this period.
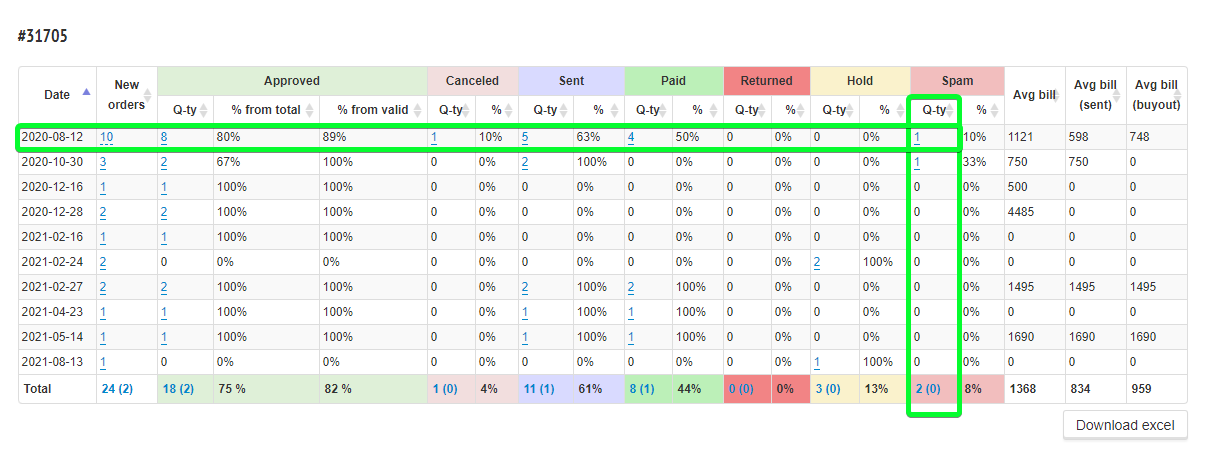
Here, in the “New orders” column, we see how many orders were received by the project during the specified period. These are all orders which were created at the period we are interested in.. All orders are counted, even if they were spam or duplicated. This is the total number of orders from which the percentage of some useful orders can be deducted.
If you click on the number in the “New orders” column, a list will expand, in which you can see the IDs of all received orders. Each ID is clickable and leads to the corresponding order card in the project.
In our example, at the screenshot, the number of new orders for August 8th = 10 orders.
And total for the entire period (from August 2020 to August 2021) - 24 orders.
The following columns collect targeted information.
Note that each group of columns in statistics is highlighted with a specific color. The colors of the columns exactly match the color of the corresponding status group.
The status group is a very important indicator when calculating statistics. The group will show where and at what level the order is now. You can read more about this in the article "What statistics are available on CRM"
Let's say your goal is to find all approved orders for a period.
Then we look at the corresponding group of columns “Accepted”. Here we see several indicators:
1. Quantity - the total number of approved (accepted) orders from those that were created during the period you specified in the search parameters. In other words: the order was created on August 12 and it was approved on any other day before you opened the page with statistics, if you select the period for displaying statistics - any one that includes August 12, you will see this order in the table and it is obligatory for Aug.12. And the order itself can be in any status group in which there can be approved orders, in any, but not in Cancellation, not in Spam and not in Processing (holds).
The number in the column is clickable, so you can see the IDs of all accepted orders and open order cards directly from the statistics. This is very convenient, because you do not need to guess which orders are taken into account in statistics and which are not.
In our example, in the screenshot, the number of orders received on August 12 = 8 orders.
And Total for all orders received from August 12 2020 to August 13 2021 - 18 orders.
2. Approved % from the total - these are all the same accepted orders created for the selected period, only as a percentage of the total number of created orders.
It is calculated according to a very simple formula: [only accepted orders from all created during the period] divided by [all created during the period] multiplied by 100%
In our example for August 12 - 8/10 * 100% = 80% (rounded)
For Total from August 12 2020 to August 13 2021 - 18/24 * 100% = 75% (rounded)
3. Approval from valid orders - here we consider the ratio of accepted orders created during the period we interested in, not to all orders created during the period, but only to all valid orders created during the period. That is, we exclude spam, errors and duplicates.
Take a look at the screenshot

Here in the "Spam" column for August 12, you see 1 order. If we exclude this 1 order from the total number of orders, then we will get the number of valid orders created during the specified period.
So, the approved % from valid orders is calculated according to the formula: [only accepted orders from all created during the period] divided by [all created during the period, excluding spam], multiplied by 100%.
In our example for August 12, 2020 - 8 / (10-1) * 100% = 89% (rounded)
For Total from August 12, 2020 to August 13, 2021 - 18 / (24-2) * 100% = 82% (rounded)
For all approved orders, there is another useful indicator - Average bill (Avg. Bill).
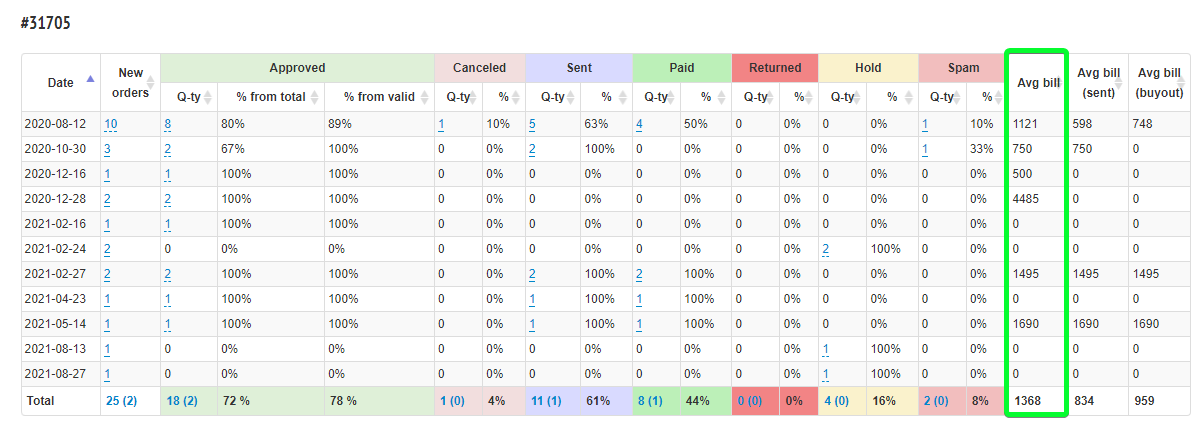
This indicator is calculated by the "Total" field in the order card. In fact, this is the total price of the order in the amount of all goods added to the order.
In the conversion statistic, in the column “Avg. bill” you see the arithmetic average of the sums Total of all accepted orders that were created during the period. (If you look at the column “Avg. bill (sent)”, then the arithmetic will be calculated not by the received orders, but by the sent ones).
For our example, from all orders that were created on August 12, 8 orders are accepted. Each order has a price in the "Total" field.
To calculate the average check for them: we sum up all the order values and divide by the number of these orders, specifically 8. We get 1368.
As you can see, the bill has no currency. It is assumed that you are working with one geo within the project, so that all your goods are in one currency.
We want you to be 100% understand how it works, so let's take a closer look:
Given:
Let there be a project that sells backpacks and multitools.
The shop sells one backpack for $2,000, a second backpack for $1,500, and offers to buy a multitool with a discount for $600.
Condition:
On August 12, 3 orders came to purchase one backpack - their numbers are id-1, id-2 and id-3.
As a result, 2 orders were accepted, these are id-1 and id-3, and one was cancelled - id-2 (we immediately forget about it, it will not be counted in the bill).
In the id-1 order, we managed to sell only one backpack for $2000 and one multitool for $600.
And in the order id-3 sold 2 backpacks without the multitool.
Question:
What will be avg. bill for August 12th?
Solution:
We look at the “Total” of each order - for id-1 it is $2600, for id-3 it is $3500.
We calculate the average bill: (2600 + 3500) / 2 = 3050 - the average bill of all accepted orders, which were created on August 12.
Answer:
3050 - the average bill of all accepted orders, which was created on August 12.
So we counted “avg bill". For columns “avg bill (sent)”and “avg bill (buyout)” the method of calculating is the same, but summed up only accepted from sent and buyout.
This is the general principle by which statistics are collected. Knowing this logic, you can easily figure out with indicators in the remaining columns.
The data in the table can be grouped:
If you often use certain methods of filtering and grouping data in statistics, you can save the template.
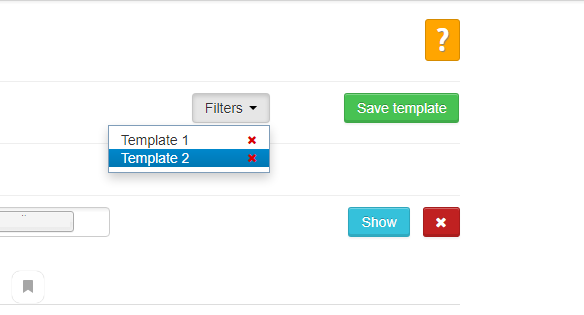
After saving the new template, you can select it in the drop-down list under the "Filters" button.
Probably, you want to see statistics in which in the “Accepted” column not all approved orders, but only those that are in statuses with the “Accepted” status group. For this purpose you need “conversion old”.
This statistics is available only in the project, which means that to load data, we first go to the desired project. On the top control panel, click on the "Statistics" button - select the "Old conversion statistics" command.
On the top right, you will see the option to choose which statistics you need:
Statistics can be viewed in the form of a sheet and graph.
If you view the graph, you will see the dynamics of two indicators: conversions and orders.
It is very important to understand that conversions or unique visitors can only be counted for landing pages hosted on our server. If the landing page is on your FTP or on a third-party service, and applications are sent to the project via API or downloaded from excel, our service will not know about the number of site visitors.
The number of orders will be calculated correctly for any source.
The statistics in the sheet will be more informative.
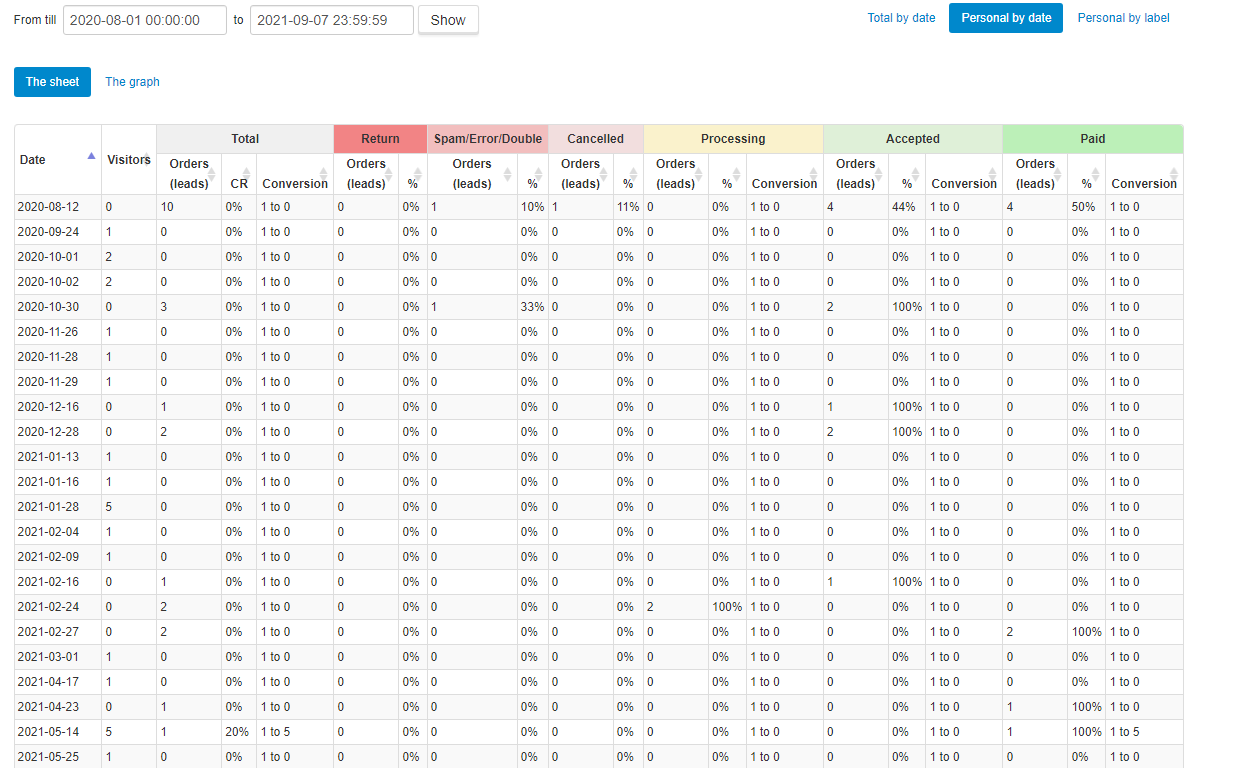
Statistics are displayed divided by date.
Next to the number of orders, there is a value that shows the percentage of such orders, depending on the target action.
For the “Processing” column, the percentage is calculated as the ratio of all orders in the Processing group, divided by all orders created during the period, excluding spam. Formula:
Processing% = [Number of Processing Orders] / ([Orders] - [Error Spam Double])
For the “Accepted” column, the percentage is calculated as the ratio of all orders in the Accepted group, divided by all orders created during the period, excluding spam. Formula:
Accepted% = [Number of Orders Accepted] / ([Orders] - [Error Spam Double])
Likewise for “Cancelled”.
For the “Buyout” column, the percentage is calculated as the ratio of all orders in the Paid group (column Buyout) divided by all orders created during the period, excluding Spam, Cancellation and Processing. Formula:
Buyout% = [Number of orders Paid (buyout)] / ([Orders] - [Error Spam Double] - [Cancelled] - [Processing]).
Likewise for “Return”
If you are tracking traffic sources by UTM marks, you can use the relevant statistics. You can find it in your account - Statistics - Personal by label.
The indicators are formed according to the same principle as in the new statistics on conversions, but they are displayed dividing by labels.
Statistics are collected for the marks “source”, “medium”, “campaign”, “content” and “term”.
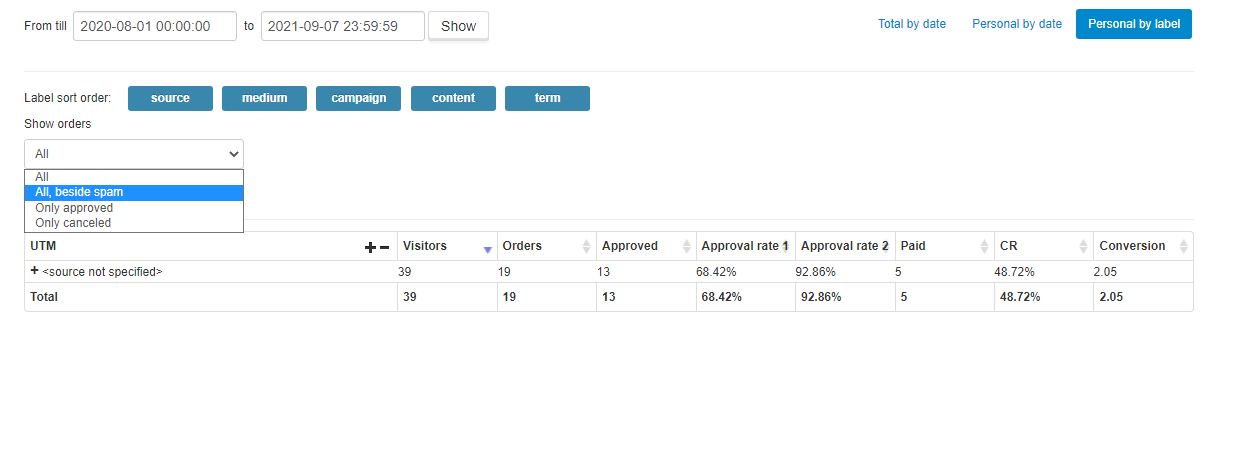
In the project - Statistics - By conversions old - you can enable sorting by labels and select the option how the indicators will be calculated, for example, without “spam”.
