Statistics is correct
Quite often tech. support gets requests asking for help to figure out with statistics.
Statistics appeared in our CRM long ago. Of course, we are actively improving it and adding new indicators, but the general principles of calculation remain unchanged. Calculation errors are excluded, but the indicators of different statistics differ and this is normal. Why? Let's figure it out at this article.
There are indeed differences in statistics. These aren’t errors, just each statistic has its own method of calculating and its own purpose, also each statistic must be unique and give answers to different questions and help to solve different tasks.
How statistics calculates
All statuses in your project are related to statuses groups. The group of statuses shows at what stage your order is. A status group can be compared to a stage in a sales funnel. The status group will show where and at what level the order is now.
The status group “Processing” is intended for all new orders.
The status group “Accepted” is intended for approval, in other words, confirmed orders.
The status group "Sent" is intended to orders which have been sent by mail / courier services.
The status group “Paid” is usually refers to final stage. This group includes statuses that indicate the fact of receiving payment from clients.
If we imagine this in the form of a funnel, then there are also status groups which contain orders that have dropped out at any stage.
The group of statuses “Error / Spam / Double” - these are invalid orders with an incorrect phone number or outright spam and orders with obscenest.
Orders gets here directly from “Processing” status group. It’s illogical to move to this status group orders, which, for example, have been calling for a long time, but the client hasn’t answered the call, so they should be in “Cancelled”, not in “Spam”.
Status group “Cancelled” - orders can get here from the “Processing” or the “Accepted” group.
For example, in case if a customer refuses an order; if you couldn’t get through to the customer for a long time, although the number is correct; if the order was accepted and moved to the “Accepted” status, but upon reconfirmation, the customer changed his mind and never answer the call.
It is illogical to move to this group orders which were lost at the post service or were sent, but were never buy out.
Status group "Return" - sent orders that were never purchased by a client and returned to the sender.
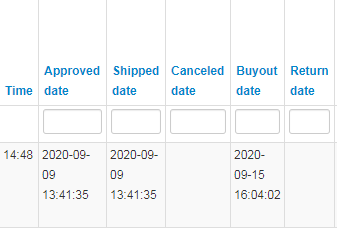
When changing status group, and in fact, when an order moves to a certain stage, the order is assigned a special date. It’s an important indicator by which statistics will subsequently be calculated.
At the time of order approval - the date of approval, at the time of sending the order - the date of sending, at the time of buyout - the buyout date, at the time of return - the date of return, at the time of cancellation - date of cancellation.
Any statistics in CRM is related to a particular date.
It sounds complicated, but really simple.
For example, you decide to calculate a buyout for November 1-10.
However, simply specifying the buyout date from 11/01/2020 to 11/10/2020 and receiving, for example, 50 orders will not be enough, because you will receive the number of orders purchased, but not the percentage of buyouts for this period and you will not be able to rate these 50 orders as a good or bad result.
For a complete picture, you need to see, how many orders during this period were sent, how many of them are still in delivery and how many have already been returned. Then it will be clear that 50 out of 70 sent is good result, but the same amount out of 170 - is worse.
In other words, to calculate a buyout percentage, you need to use statistics on the date of sending, based on the date when the order was moved to the “Sent” status group.
When you understand the purpose of tone or another statistic, you’ll have no doubt that it shows correct data.
What tasks helps to solve one or another statistics
By conversions, by tags and by webmasters
These statistics allow you to analyze the quality of incoming traffic and advertising sources, to see in what season or period a certain product or service is selling better, to determine how much better one offer is selling in comparison with another.
All these statistics are related to an order creation date.
For example, statistic by conversions is related to the order creation date and show how many clicks were committed to your landing and how many orders you received during the period.
And you can also see how the quality of these orders, and how they were distributed into groups: how many of them were cancelled, and how many were accepted, how many are in delivery right now or have already been purchased.
Can buyout be checked with this statistic? It depends on what goal you are pursuing. If you want to check how much better this month's buyout than the previous, then this summary will be suitable. If you want to check how your delivery service works by days, how quickly orders, which were sent last week has been bought out or how your courier services work, then the statistics by buyout will suit you. It will show how many orders and on what amount were buyout from those that was send within the specified period.
By processing (by operators)
If you need to evaluate an efficiency of your operators, you need to use these statistics.
It will show the operators' real approval and the quality of their work. It means, that the date of creation of an order is absolutely not important here. What difference does it make when this order came: in October or in November, if the operator has accepted this order today? After all, it happens that a client asks to call back in 2 weeks, as a result - the operator calls back and accepts the order. In the statistics by conversions, this approval will be considered on the date 2 weeks ago, in the statistics by operators – for today.
Other statistics
We have other statistics that work according to different formulas, with their own unique calculation methods. If you want to learn how to work correct with statistics, order a consultation and we will help you figure it out. Any such consultation is absolutely free.
It’s our pleasure to help you in your work!
No limits
If you realize the statistics, understand how each one works, but still want to count using your own unique method, use Advanced Search. There you can use date filters in any way you like. Search results can be exported to Excel file with your own formulas. Our specialists can create a personal form for just 600 Rubles. For order such service, please text to the tickets.
